Usage#
To execute the code, run the following command:
EDX_AI
The application will open in a new window. From there, you can load data, apply decomposition algorithms (PCA, NMF), and visualize results.
Presentation of the interface#
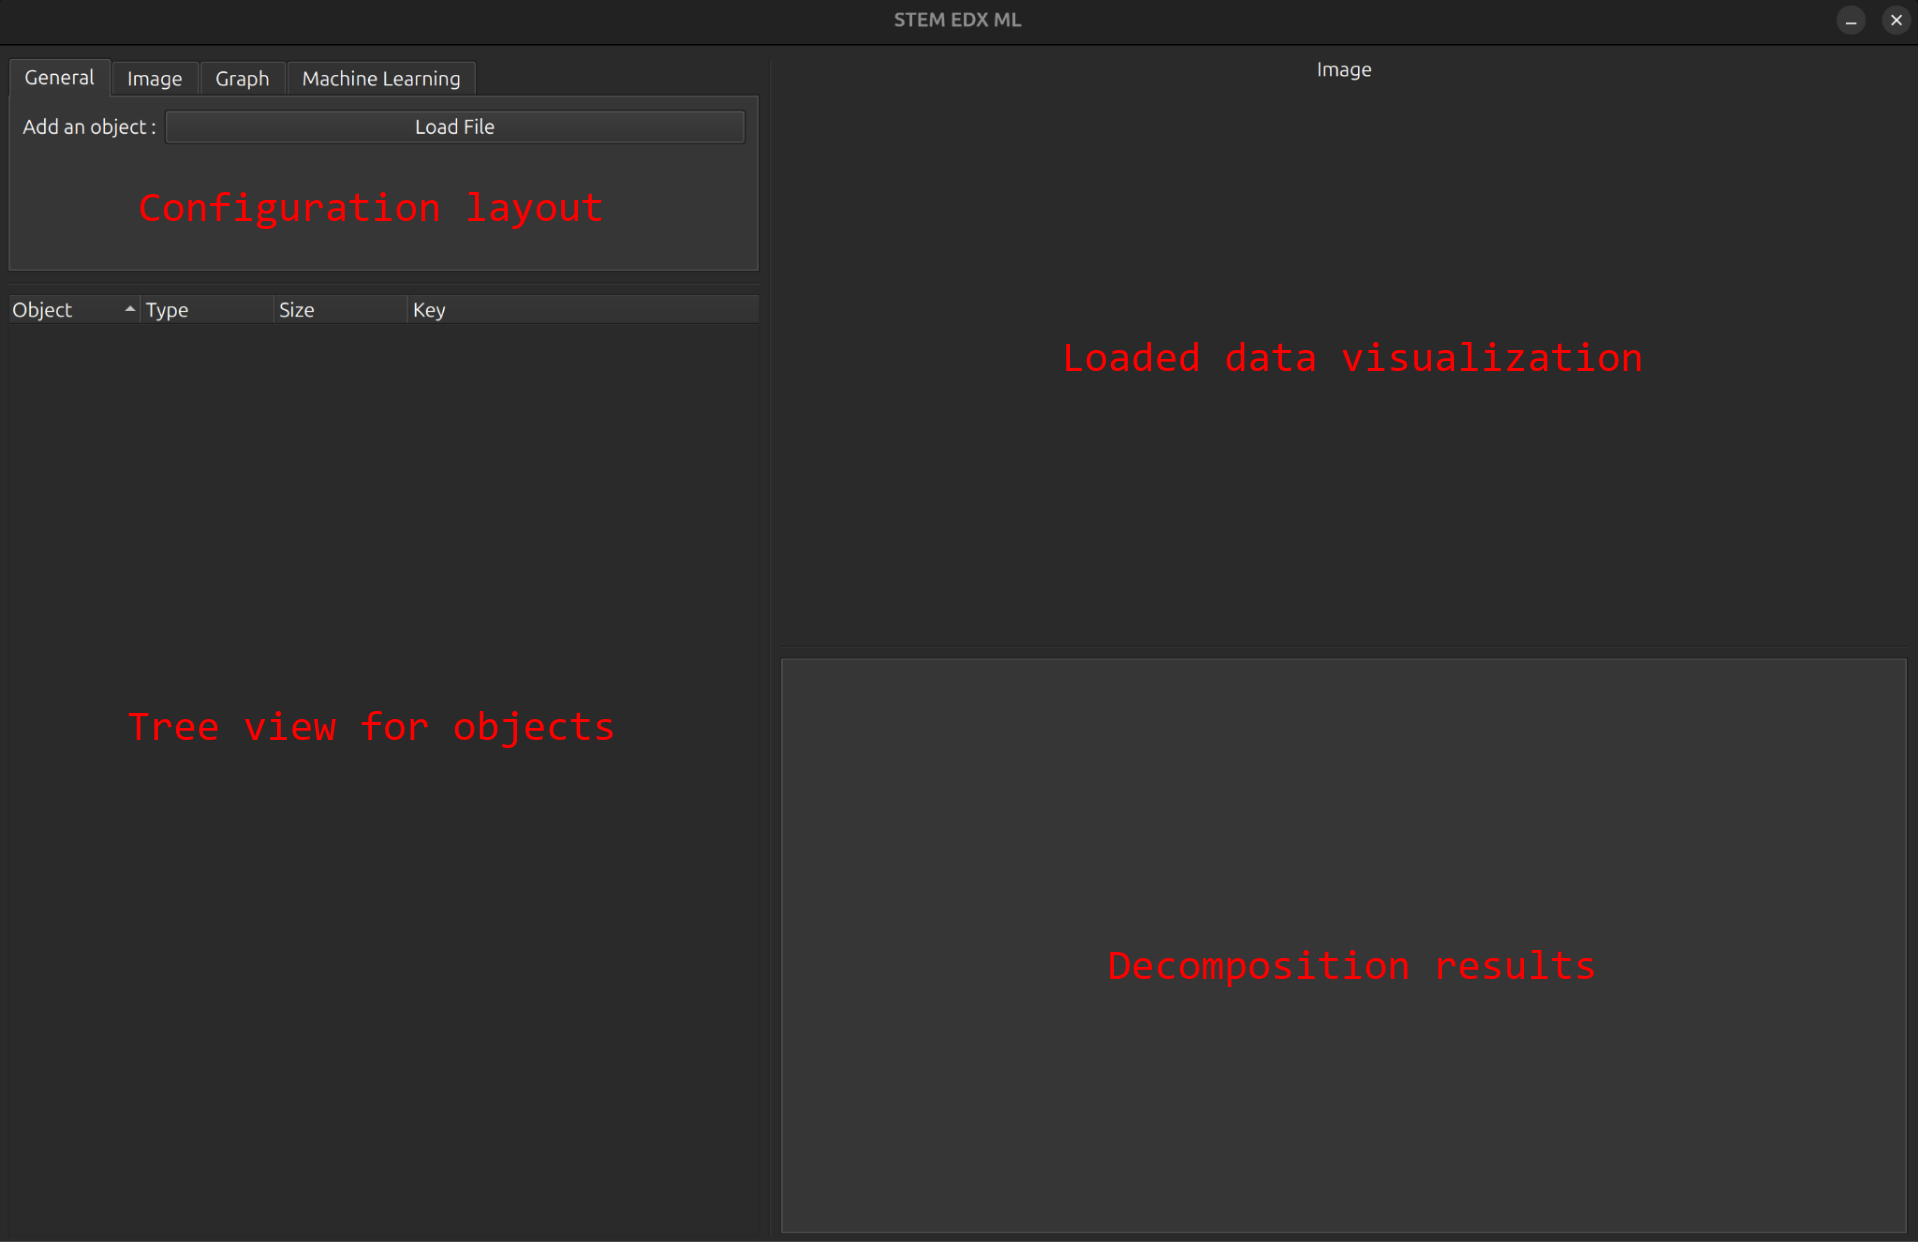
The interface is divided into four main sections:
In the top left layout, you can access to all the parameters organised in different sections. You can load files, apply decomposition algorithms, and visualize results.
In the top right layout, you can see the data loaded and explore the datacube pixel by pixel. The datacube is displayed in the form of a 2D image representing the sum over the energy axis of intensities.
In the bottom left layout, you can access to all the objects loaded in the session. Each file loaded is represented by an Object (usually names as “Object 1”, “Object 2”, etc.). You can select the object you want to work with and apply decomposition algorithms. Decomposition results are stored in the form of a new object, as child-objects of the loaded files objects.
In the bottom right layout, you can see the results of the decomposition algorithms applied to the data. You can visualize the loadings and the scores of the decomposition, and navigate through components.
Load data#
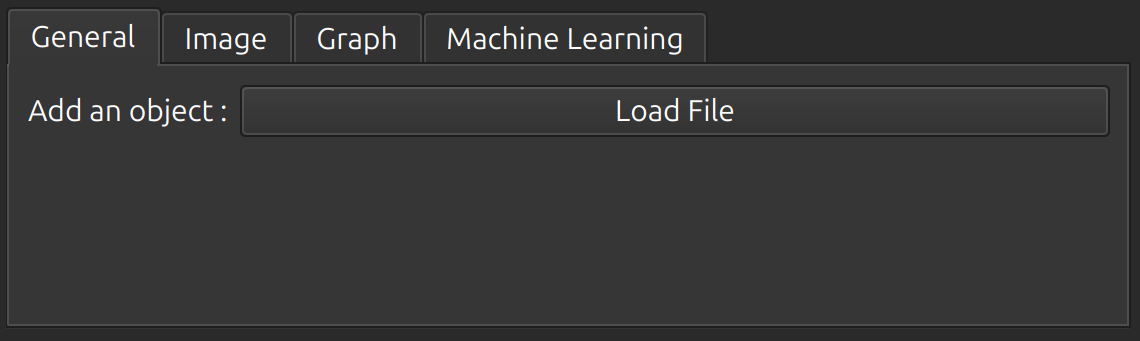
First of all, you need to load data. You can do this by clicking on the “Load data” in the button and selecting the file you want to load.
The files must be in the form of a 3D datacube, with the first two dimensions representing the spatial dimensions and the third dimension representing the energy axis.
Currently, only .pts files are supported.
Visualize loaded data#
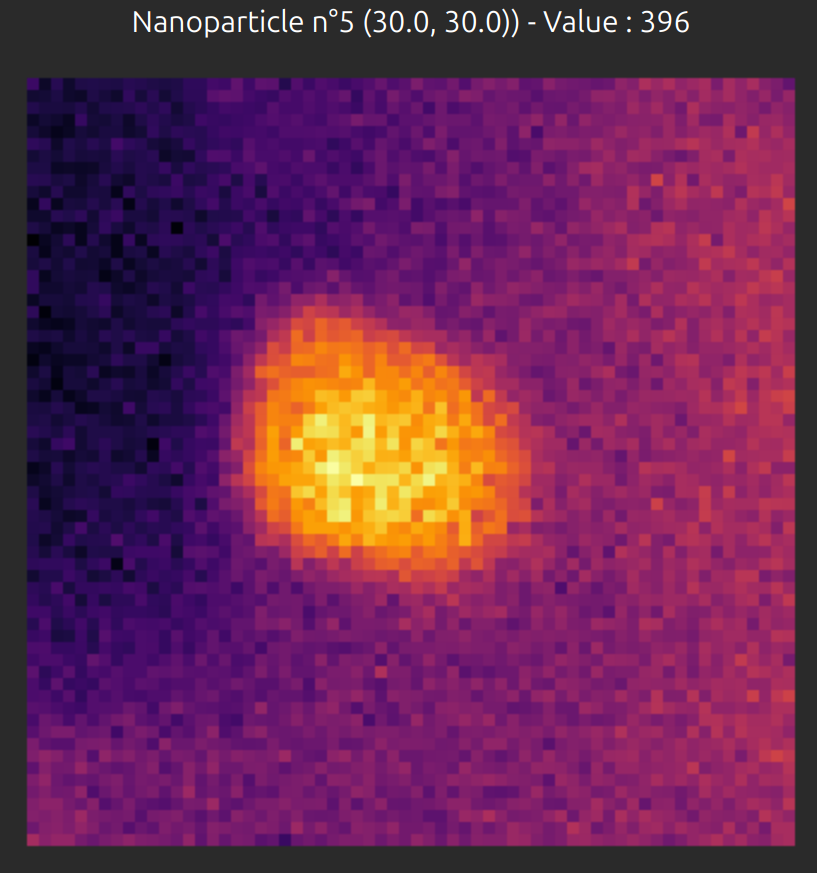
Once the data is loaded, you can visualize it in the top right layout.
The datacube is displayed in the form of a 2D image representing the sum over the energy axis of intensities.
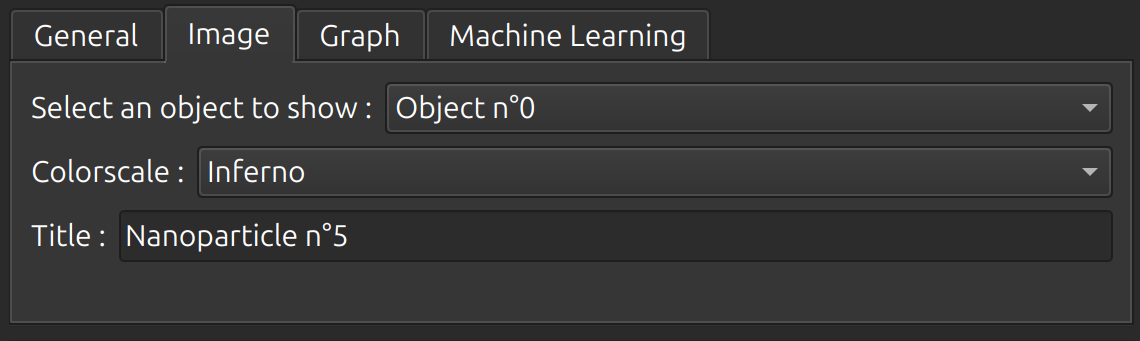
From the Image tab, you can control the graphical representation of the datacube.
You can change the colormap or the title of the image. Several colormaps are available :
Greyscale
Jet (unrecommended)
Hot
Viridis
Plasma
Inferno
You can use your mouse to explore the values pixel by pixel.
Apply decomposition algorithms#
Once the data is loaded, you can apply decomposition algorithms.
First, you need to select the object you want to work with in the bottom left layout (by using the checkbox).
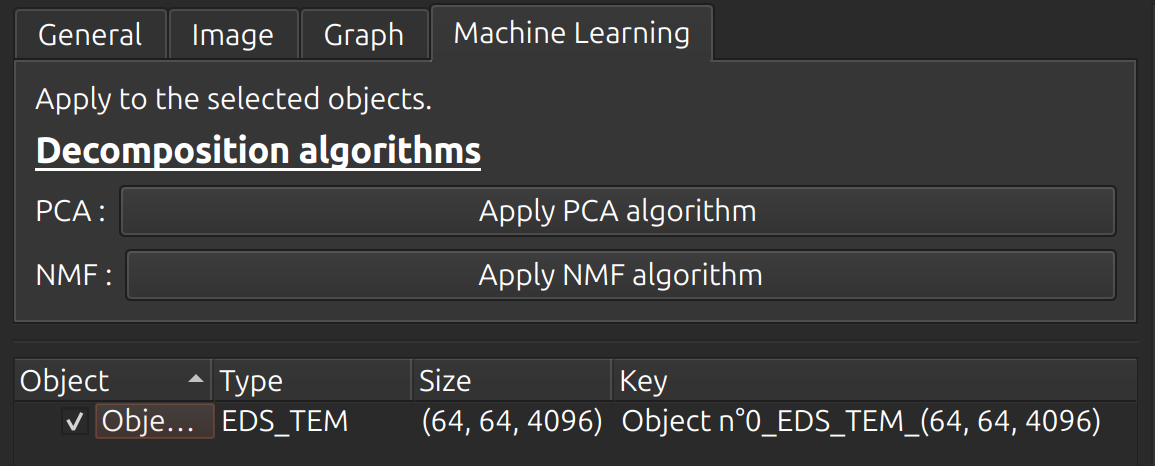
Then, you can apply the decomposition algorithms in the Machine learning tab.
Currently, two decomposition algorithms are available:
PCA (Principal Component Analysis) : a linear decomposition method that aims to reduce the dimensionality of the data while preserving as much variance as possible.
NMF (Non-negative Matrix Factorization) : a linear decomposition method that aims to factorize the data into two matrices with non-negative elements.
The decomposition process will freeze the interface until the process is finished, a progress bar will appear to show the advancement.
Once the decomposition is finished, a new object is created as a child of the loaded file object.
You can visualize the results in the bottom right layout.
Tree view for the objects#
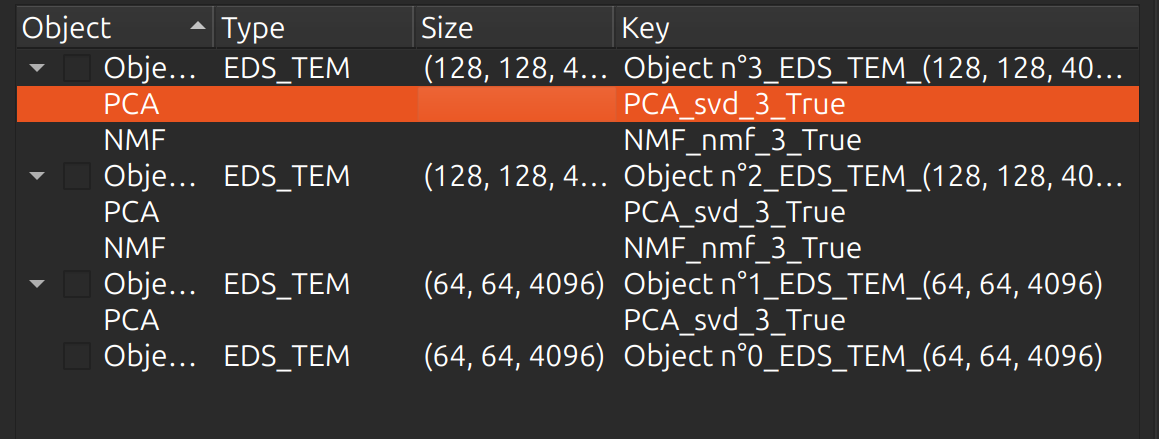
In the bottom left layout, you can access to all the objects loaded in the session. Each file loaded is represented by an Object (usually names as “Object 1”, “Object 2”, etc.). You can select the object you want to work with and apply decomposition algorithms.
By right-clicking on an object, you can access to its metadata in a context menu window.
Once an object is selected, an highlight will appear in the tree view.
You can also choose objects for decomposition by using the checkbox.
A key is assigned to each object, which is used to identify the object in the tree view. It contains informations about the object, such as the name of the file, the shape of the datacube, and the date of creation. For decomposition results, the key also provides informations about the decomposition algorithm used and the number of components.
Visualize decomposition results#
Once the decomposition is finished, you can visualize the results in the bottom right layout.
To do so, you need to select the object you want to visualize in the bottom left layout. Then, usin the graph tab, you can visualize the loadings and the scores of the decomposition, and navigate through components in the bottom right layout.
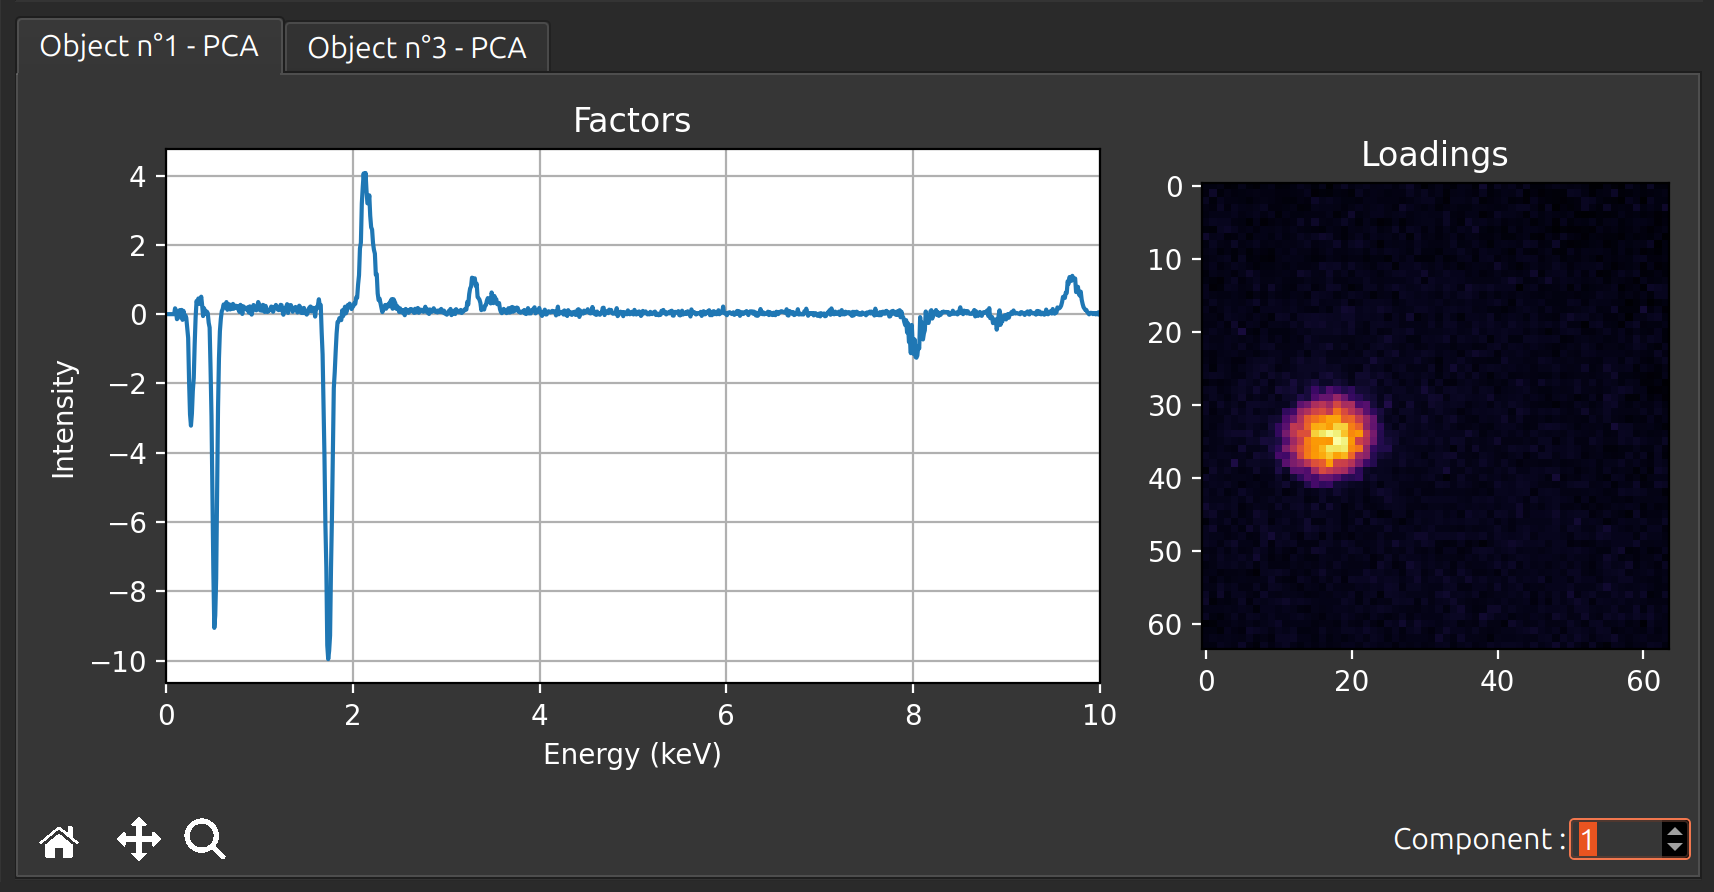
The graph tab also allows to save the current graph plotted in a .png file by clicking on the corresponding button.